It happens in many companies: you have data in the CRM, numbers in the ERP, metrics in the marketing platform and three spreadsheets floating around by email. At the end of the month, your team wastes hours crossing all that information by hand to put together a report that, by the time it is delivered to you, is already old.
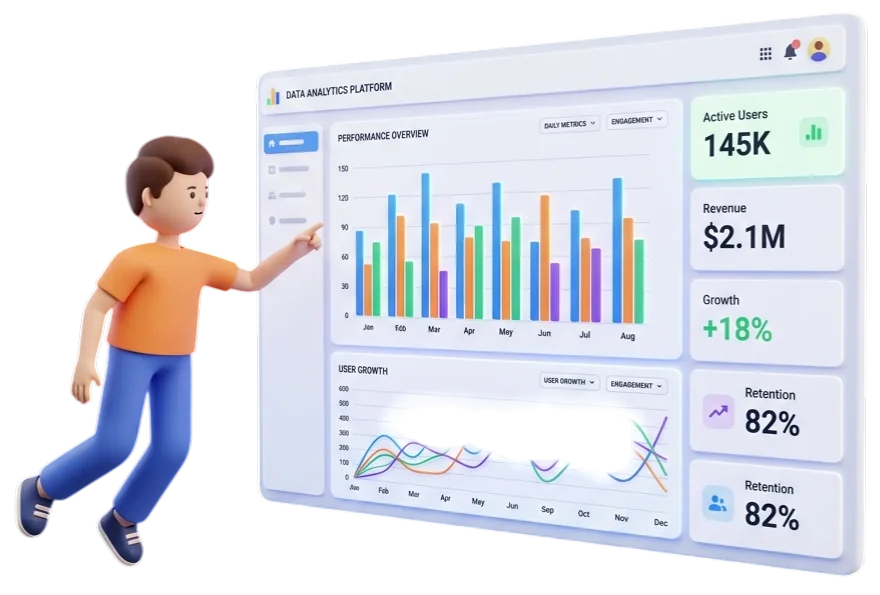
At Softuo we design dashboards that put an end to this chaos. We turn scattered data into actionable decisions. We set up a single screen where, at a glance, you know exactly what is happening, why it is happening and where you have to put out the fire first.
The end of manual reports and endless meetings
A good internal dashboard is not a bunch of pretty graphics; It is the steering wheel of your company. When information flows in real time, your business changes completely:
- Discussions over data are over: the entire team looks at the same numbers and speaks the same language. There is no longer a doubt whether marketing or sales are to blame; The data is unique and transparent.
- You see the problem before it explodes: You detect bottlenecks in your operations instantly, allowing you to react days or weeks before they impact your monthly billing.
- Beastly time savings: zero hours spent exporting and importing files to consolidate information. The system does it alone, 24/7.
- Full control of objectives: You know in real time if you are meeting your service level agreements (SLA) or if you are about to lose an important customer.
How we build your dashboard at Softuo
We don't plug you in a generic template and we wish you luck. We build useful tools for both the manager who makes decisions and the operator who executes them:
- Cleaning and defining KPIs: We do not measure for the sake of measuring. We sit down with you to isolate the noise and define only the key metrics that really move the needle.
- Pipe connection (integration): We connect to your data sources (bases, APIs and third-party software), extract the information and normalize it so that everything fits.
- Visual design for humans: we avoid incomprehensible graphics. We design clean interfaces where red means “act now” and green “everything is in order.”
- Views by role and alerts: the CEO sees global profitability, the commercial director sees month-end and support sees urgent tickets. Each profile has its own view and automatic alerts.
Your business is speaking to you. It's time to listen to it.
Having a lot of information scattered is the same as having none. Turn your data into the most unfair competitive advantage in your sector.
Click on "Contact us" and let's talk about how to set up a control panel that gives you complete control of your company.